Chapter 9: Polygenic risk scores#
In the previous chapter, we performed GWAS to identify regions of the genome associated with complex traits. In this chapter, we will attempt to use the results from GWAS as a starting point to build predictive models to predict a person’s value of a trait (or risk for disease) from their genome.
The ability to predict traits from genomes has multiple potential clinical applications. For example, if we could predict who is most at risk for heart disease, we could prioritize them for treatment with cholesterol-lowering statin medication. Or, if someone is predicted to have high risk for breast or prostate cancer, they can be prescribed earlier and more frequent screening for those conditions. Another use case could be determining the best course of treatment by using a person’s genome to predict the outcome of different treatments.
As in GWAS, we’ll be focusing on complex, or polygenic, traits, which have contributions from many genetic variants across the genome. To predict these traits, we will build polygenic risk scores (PRS), which you might also see referred to as polygenic scores (PGS).
We will see multiple ways to construct PRS, but most final scores consist of a weighted sum of SNP genotypes across a set of trait-relevant SNPs \(S\):
where \(PRS_i\) is the score for person \(i\), \(w_j\) is the weight of SNP \(j\), \(X_{ij}\) is the genotype (0, 1, or 2) of person \(i\) at SNP \(j\). \(S\) here is the set of SNPs included in the score, which will differ between different scores. Note these scores are making several simplifying assumptions about the genetic architecture of complex traits:
Assumption 1: Additivity: as in GWAS, by using these linear models we are assuming all relevant SNPs show additive associations with the trait of interest. That is, heterozygotes have half has much as homozygotes for the risk allele at a particular SNP.
Assumption 2: Independence: We are assuming each SNP’s contribution to the trait prediction is independent (and additive). That is, if we have two SNPs with weights \(w_1\) and \(w_2\), we can model \(Y=w_1X_1 + w_2X_2 + \epsilon\). We are ignoring any interactions between different variants.
We typically will think of these scores as giving someone’s risk or trait prediction relative to the rest of the population, rather than as giving an absolute risk value, as illustrated below:
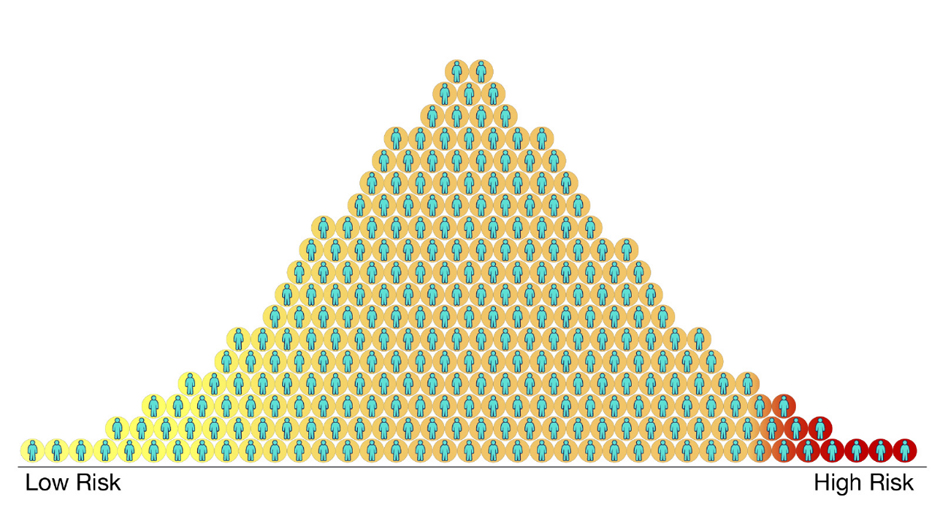
Source: https://www.cdc.gov/genomics/disease/polygenic.htm. Polygenic risk scores can be used to determine who is at high vs. low risk for a trait.